InvestigateTime, as depth
Go back to the moment it happened.
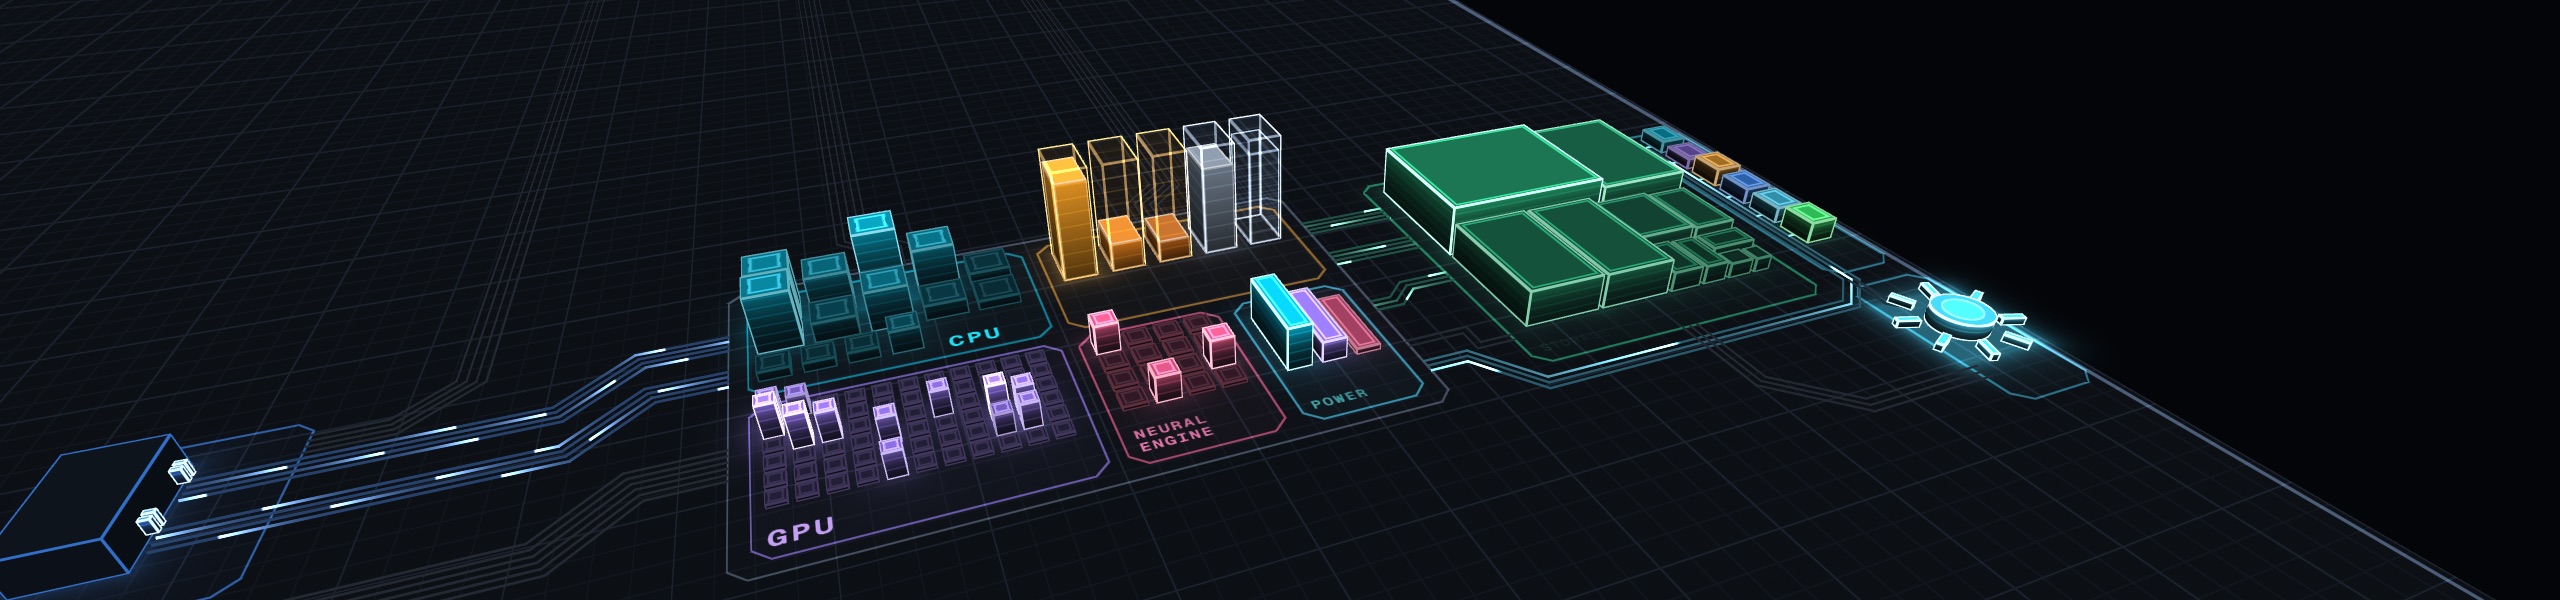
Most monitors only show the present. l/Activity also keeps the last minutes sample by sample, summaries for up to a year, and recordings you can replay and compare. When something stays busy, it notices and marks the time.
- Full detail
- 5 to 30min
- Every sample, with the apps that were running.
- Summaries
- 1year
- One per minute, for the whole Mac.
- A recording
- 24h
- By default. You set the length and the size.
- Rules
- 15
- Each with its own threshold and duration.
00Investigate4 sections
01History1 of 4
Rewind, sample by sample
History keeps every sample of the last 5, 10 or 30 minutes, including which apps were running in each. Drag along the strip or jump to a flagged peak, and the page tells you who was busiest at that moment.
This is how the app shows itHistory · Recent details
Sorted by measured CPU-seconds. Exited apps remain available for inspection. A partial label means some process measurements are unavailable.
- 1Apps that quit stay in the list. If the culprit has already closed, you still find it.
- 2Any resource, any app. Chart CPU, GPU time, memory, disk or network for one app across the window.
- 3The past is labelled as the past. A banner says what you are looking at, with Return to Live beside it.
02Summaries2 of 4
A year on one strip
Every minute, l/Activity saves a summary of the whole Mac: CPU, GPU, memory, disk and network. Thirty days are kept unless you ask for more, up to a year. A weekly report sets last week beside the one before.
This is how the app shows itHistory · Summaries
Measured summaries saved in /Users/sam/Library/Application Support/app.activity.desktop/Profile/History
- 1Per app too, if you want it. Saved app history is off until you choose how long to keep it.
- 2Small on disk. Summaries are counters, not recordings.
03Sessions3 of 4
Record it. Replay it. Compare it.
Press ⇧⌘R and l/Activity records everything in full detail until you stop. Give the recording a name, mark the moments that matter, and replay it later as if it were live. Record again after a change and set the two side by side.
This is how the app shows itSessions
System totals cover all saved pages. Missing source intervals are excluded. Totals depend on recording length; averages cover only measured time.
Choose the same duration in each recording. Paging through replay leaves this selection unchanged.
- 1Before and after, fairly. Match the same stretch of both recordings, starting from a marker.
- 2It survives a crash. Samples are written as they arrive, and an interrupted recording is kept.
- 3Yours to take away. Export a whole recording as JSON or CSV.
04Diagnostics4 of 4
It notices what lasts
A short spike is normal. Load that stays high for half a minute, memory that keeps growing, peaks that keep coming back: those are worth a look. Diagnostics files each one as an observation, places it on a strip of the last hour and links it to its moment.
This is how the app shows itDiagnostics
Optional, local recordings of new observations
Observations use continuous measured windows. Pausing, waking, missing readings, and process restarts break those windows.
- 1Show in timeline. One click from the observation to what else was happening.
- 2Keep the evidence. Save the seconds around an observation, by hand or automatically.
- 3Notifications when you want them. Off until you turn them on, and tuned rule by rule.
05What it will not claim
A lead, never a verdict
Correlation, not cause
An observation names the app that was using the most at the time. It says that is where to look, not that it is to blame.
Growth, not "leak"
It can tell you an app’s memory kept growing. It does not call that a leak.
Measured time only
Averages cover the time that was measured. Sleep and pauses are gaps, never zeros.
Kept on your Mac
History, summaries and recordings are files in the app’s folder. Nothing is uploaded.
06Guides
Do it step by step
- InvestigateLook back at what happened earlierRewind the last two minutes, the last half hour, or the last year, and see which app was busy.
- InvestigateRecord a slowdown, then compare before and afterCapture a stretch of work in full detail, replay it, and set it beside a second recording.
- InvestigateGet told when something stays busyRead what Diagnostics noticed, jump to that moment, and switch on notifications for the patterns you care about.
Version 2.3411.9 MB
Get l/Activity
A native app for Apple silicon Macs. No account, nothing to set up.
macOS 14 or later · Apple silicon11.9 MB